ColorDx® CCT HD®
Fundamentals
CCT HD is based upon the principle of stimulating individual cone type populations, L-cone (long wavelength), M-cone (medium), and S-cone (short).
Fundamentals of Cone-isolation Contrast Sensitivity
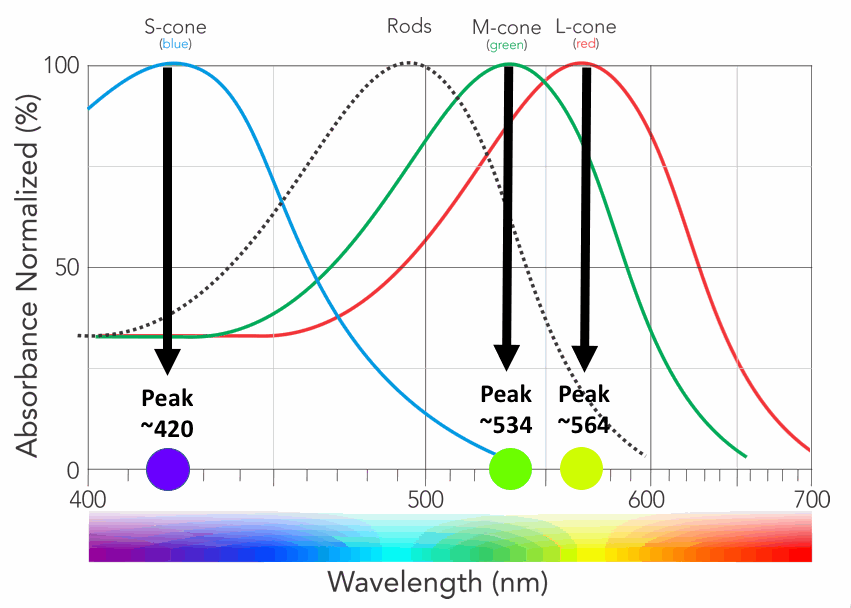
CCT HD is based upon the principle of stimulating individual cone type populations, L-cone (long wavelength), M-cone (medium), and S-cone (short). Each cone population has offset peak sensitivities and broad ranges of sensitivities. Although L-cones are often referred to as “red”, M-cones as “green”, and S-cones as “blue”, peak sensitivity wavelengths of the cone populations are colors not fitting these descriptions.
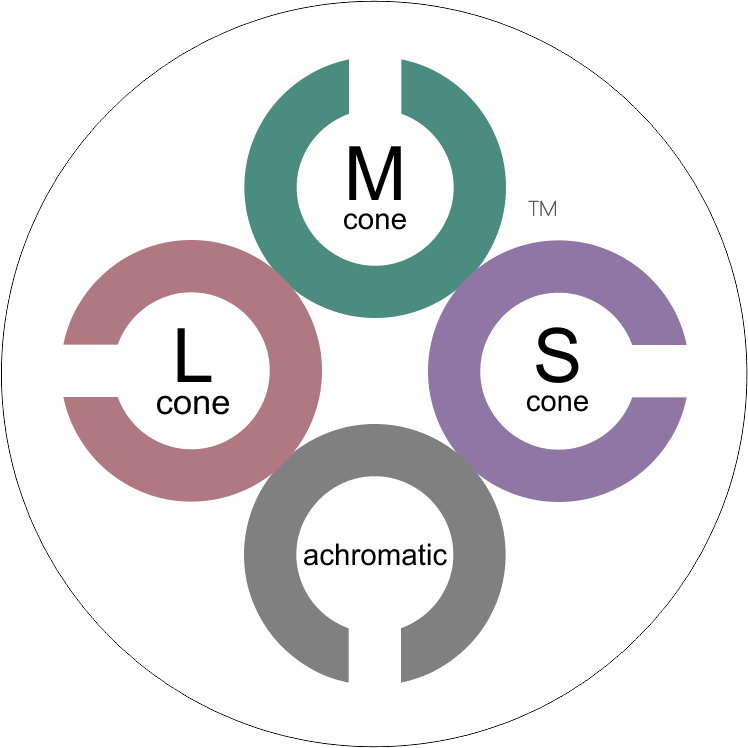
CCT HD tunes the calibrated stimulus color composition to simultaneously maximize the response of a targeted cone population, minimize, as negligible, the response of non-targeted cones, and neutralize achromatic (brightness) cues.
L-cones have the best sensitivity of the 3 cones for “red” wavelengths, but with a peak sensitivity that is not “red”. M-cones have strongest sensitivity for “green” wavelengths and S-cones have the strongest sensitivity for blue and violet wavelengths. There is little wonder why many emergency vehicles are colored in the range of the peak sensitivity of the largest cone populations where there is the highest sensitivity from our central vision.
Cone Populations Importance
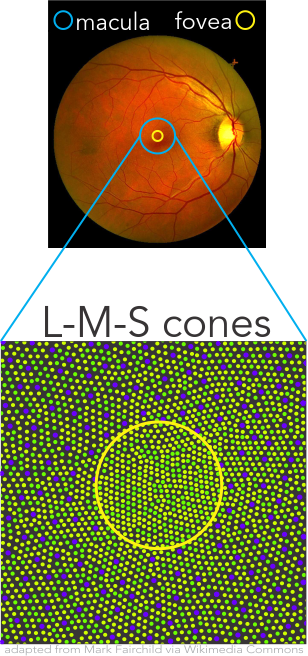
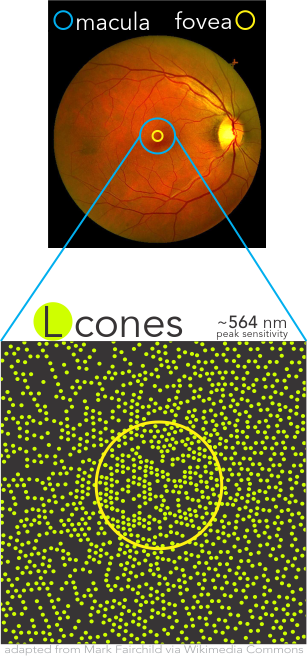
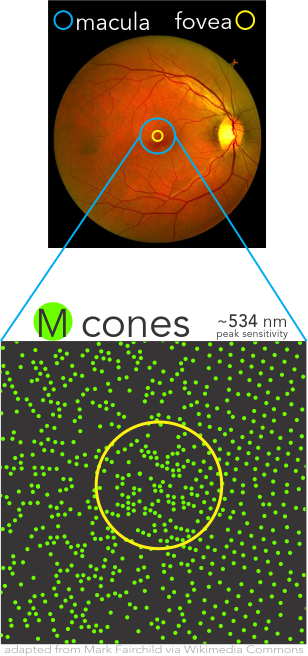
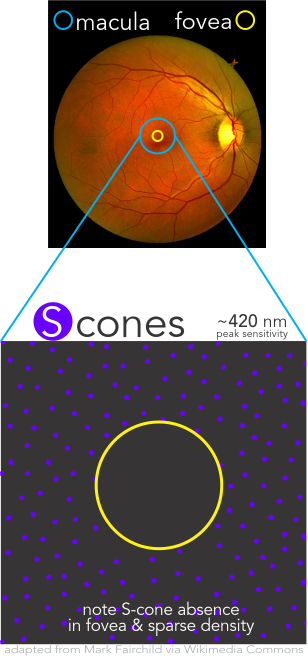
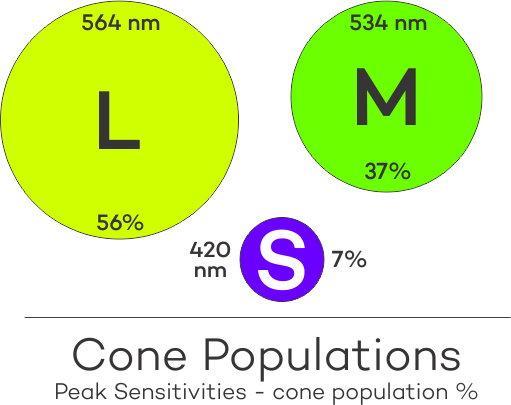
Densities of the individual cone populations are asymmetric with L-cones making up over one-half, M-cones over one-third, and S-cones less than 10% and uniquely being completely absent from the Fovea Centralis.
Cortical interpretation of the mix of differential responses of the cones drive the percept of color using multiple mechanisms, such as (L-M), S – (L+M), and brightness with L+M. Precision assessment of these aspects are simply not available with most historical methods of color vision testing.
Cone Density
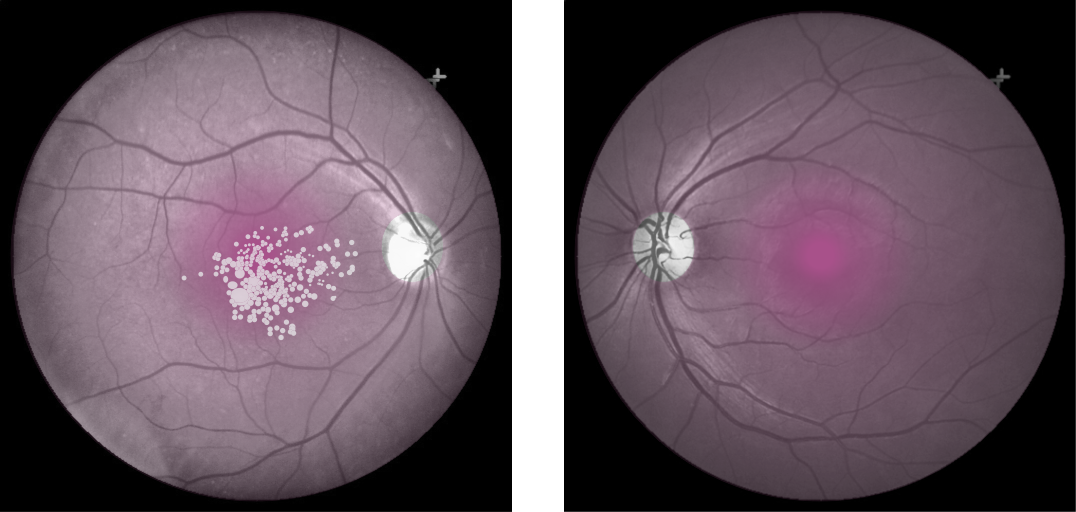
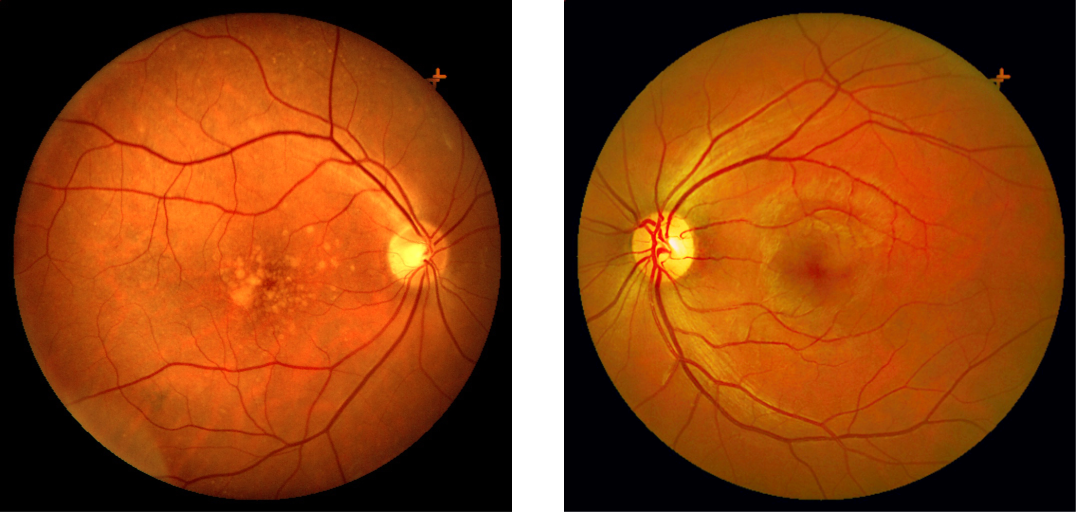
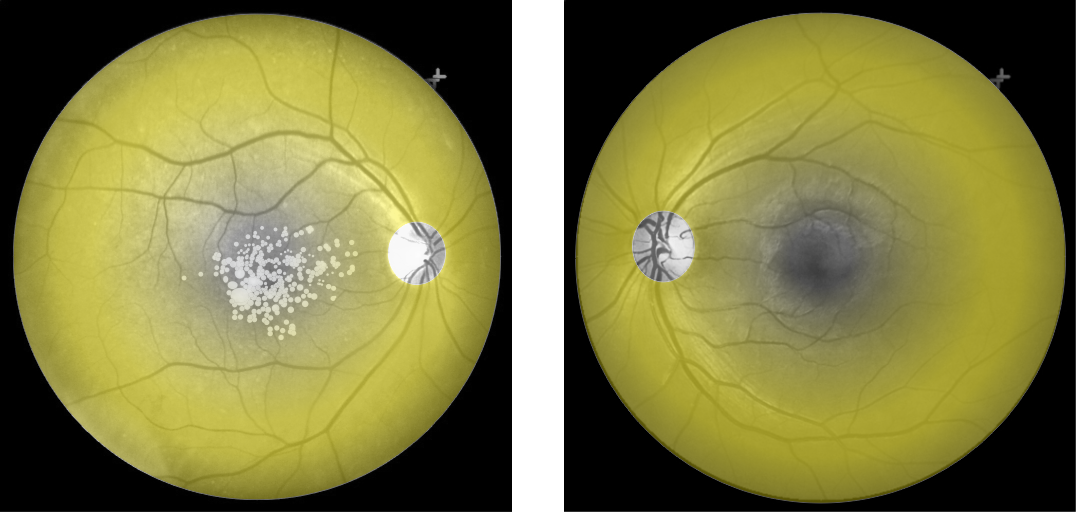
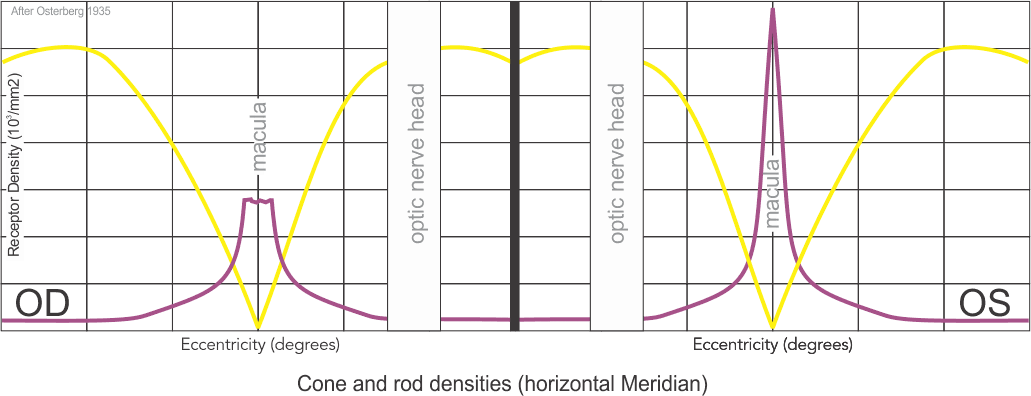
Cones density (illustrated here as a “violet” pseudo-color overlay) is highest at the macula rapidly becoming sparse to the peripheral retina with rods (density illustrated here as “yellow”) having a complement density distribution. With the high concentration of cones in human central vision, it is no wonder that Konan’s core interest in the medical/clinical ramifications of cone function, as a functional vision test assessed with cone-isolation contrast sensitivity, is in it’s importance as a tool for physicians to better understand onset and changes that may manifest from acquired conditions, such as those affecting retina and macula.
CCT HD Test Structure
The CCT HD test is structured with a series of language / literacy neutral Landolt C optotypes presented sequentially at a fixed visual angle against a defined grey background over a range contrast values from the background, exactly a contrast sensitivity test but not
achromatic as with conventional contrast sensitivity testing.

The subject simply indicates, on a for-purpose large 4 button arrow response pad, the observed direction of the opening of the “C”, forced-choice, with a simultaneous auditory response cue. Cue context is operator defined.
High Fidelity Testing: Importance of Granularity
CCT HD critically requires a high-precision color display with verified technical characteristics. After a dual synchronous calibration, CCT HD creates precision, repeatable very-low contrast values to extend cone contrast testing to approximate the limit of human perception. Along with precision color rendition, negligible inclusion of color contaminations from the not-targeted cone populations, provides characteristics needed to create “High Fidelity” cone-isolation contrast sensitivity utilizing highly granular stimulus steps.
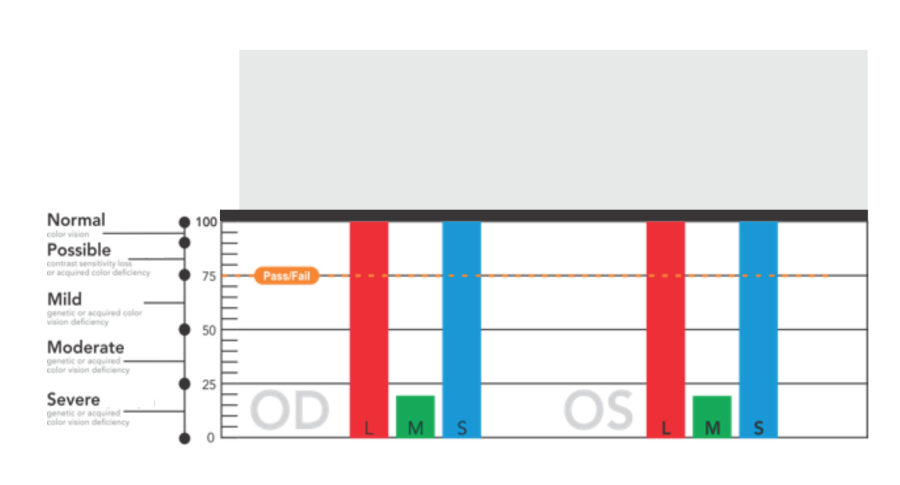
CCT HD testing to very low Contrast
(low contrast "ceiling" removed)

Original USAF test had low contrast "ceiling"
High Fidelity Testing: Importance of Low Contrast Range
With the availability of very-low contrast targets, CCT HD eliminates the low-contrast “ceiling” that binned most “normal” performing individuals into a single category. The US Air Force determined that this single bin actually was comprised of a normal distribution of results that may be important for assessing changes over time even in the normal populations. A system that reliably can display very-low contrast values (~0.25%) is essential to adding this extended low contrast range.

Why Bayesian Thresholding?
The Bayesian threshold method, “Psi Marginal Adaptive” technique, dynamically calculates, from prior responses, each successive test target contrast value until the threshold for each cone population is derived. This dynamic calculation streamlines “zeroing in” on the contrast thresholds, which are reported as Log CS, % contrast, and a score for convenience of comparison for users of the original USAF CCT test.
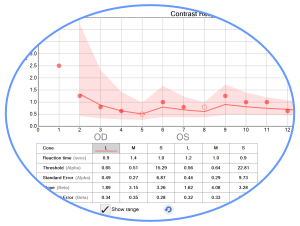
Particularly useful for clinical trials, statistical Standard Error calculations and trends analysis with prior tests, are automatically reported. A “high-precision, marginal threshold logic” is also available (developed with USAF School of Aerospace Medicine) for assessments of knife edge cut-off criteria typically used in military qualification settings.
Cone-Isolation History
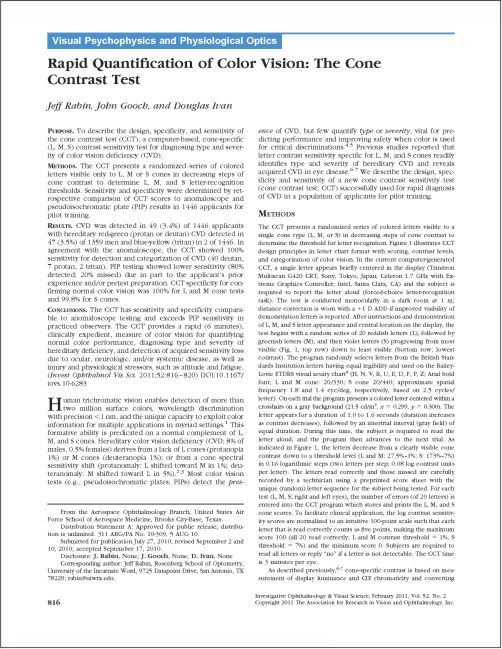
Based upon landmark research of Jeff Rabin in the 1990’s with original CCT product 2011 including peer-reviewed research from Jeff Rabin, John Gooch, and Douglas Ivan in 2011 (right) with USAF.

The US Air Force, School of Aerospace Medicine OBVA (Operational Based Vision Assessment) Team initiated a research project with global allied partners (below) and engaged Konan Medical USA under CRADA to collaborate in the development of a new cone-isolation test to enhance precision, usability and low-contrast range of functional vision testing. ColorDx CCT HD is the result of this effort commercialized late in 2017.

