FOURIER TRANSFORM ANALYTICS:
THE SECRET SAUCE OF EVOKEDX
A novel approach to visual electrophysiology:
What goes in (stimulus), should come out (response) in a normal, healthy system.
The following process describes how/ why the EvokeDx icVEP system works:
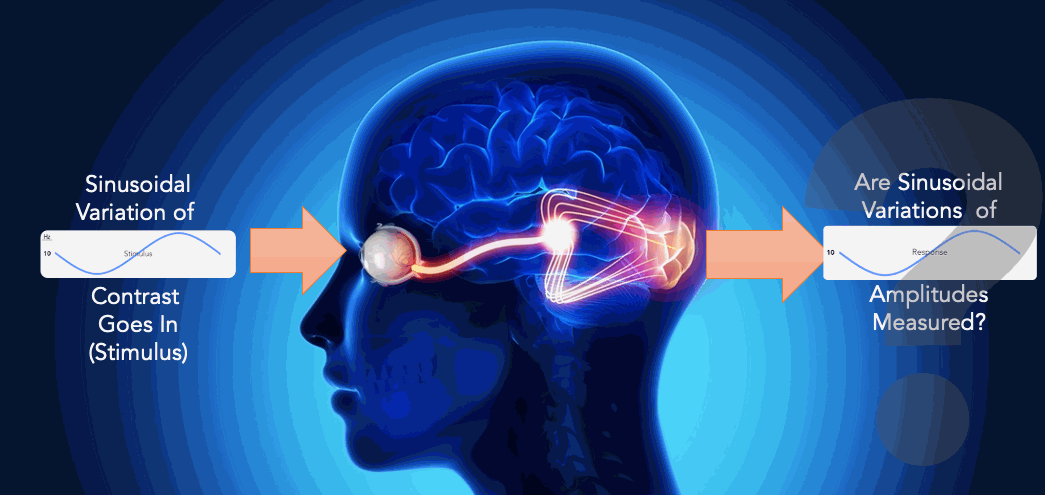
precision replicated timing at the vision cortex. Intuitively simple, technically brilliant.
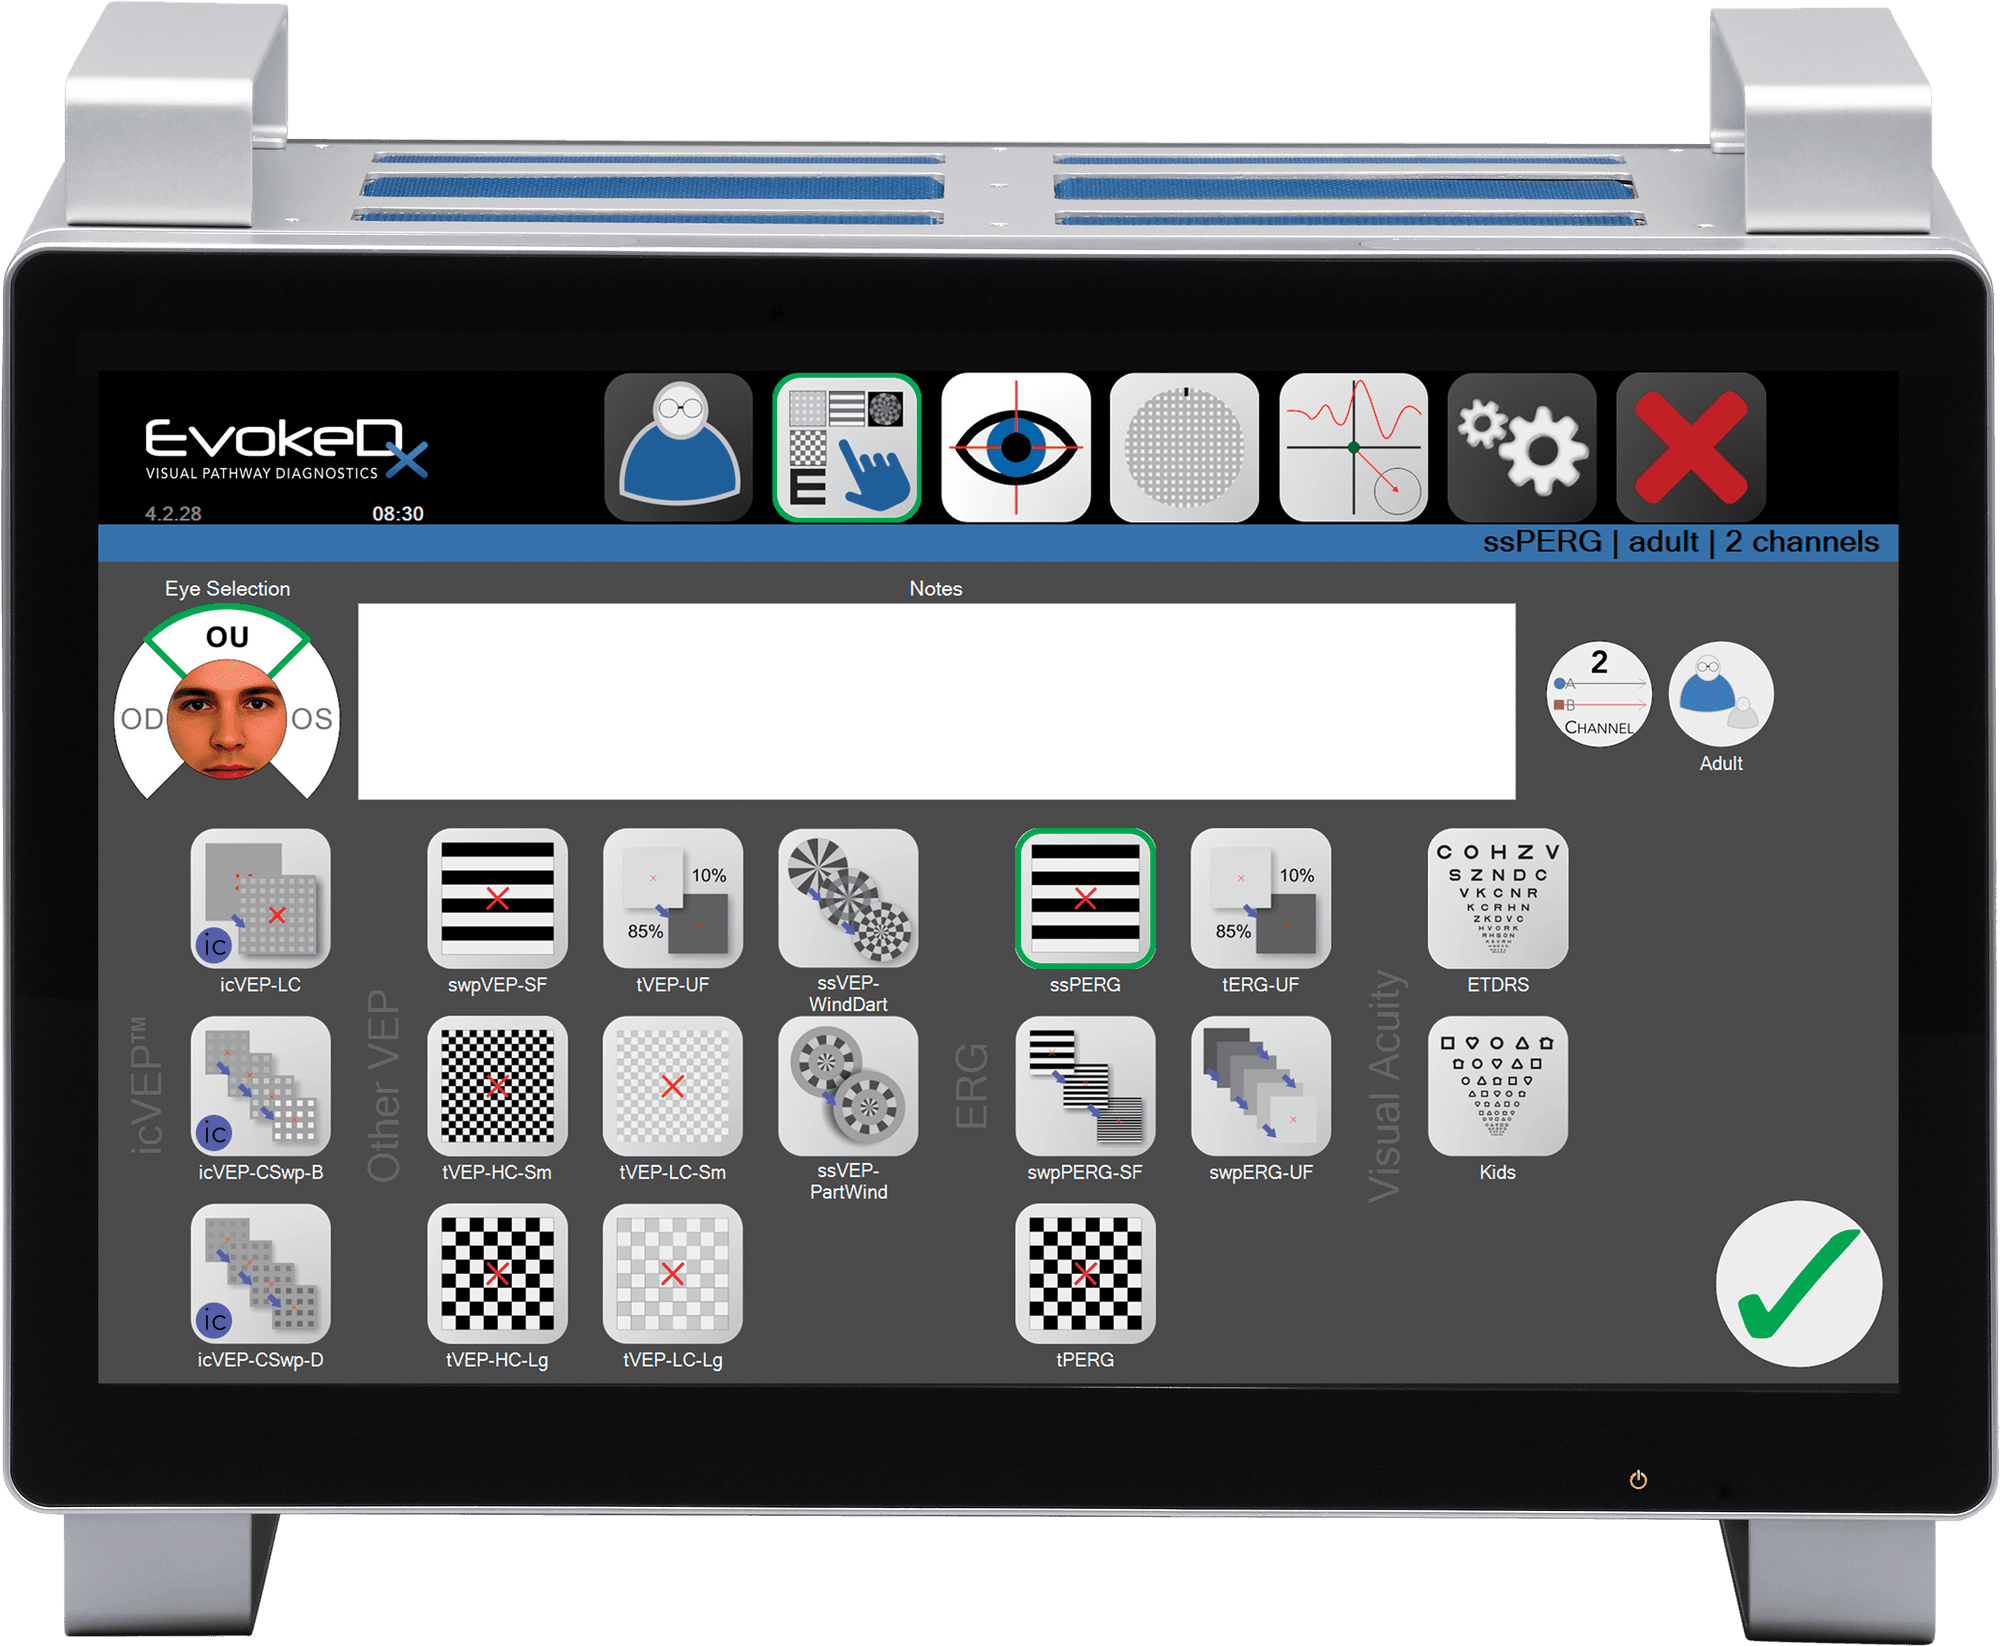
Process: icVEP Stimulus
A low-contrast, high temporal frequency (10 Hz) matrix of isolated checks (not connected like a checkerboard) are displayed by sinusoidally varying the contrast.

This pattern is thought to target the M-Cell pathway.
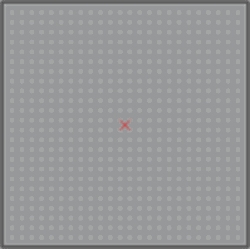
Demonstration of sinusoidal modulation
Slowed from 10 Hz to ~ 1Hz to easily see the effect.
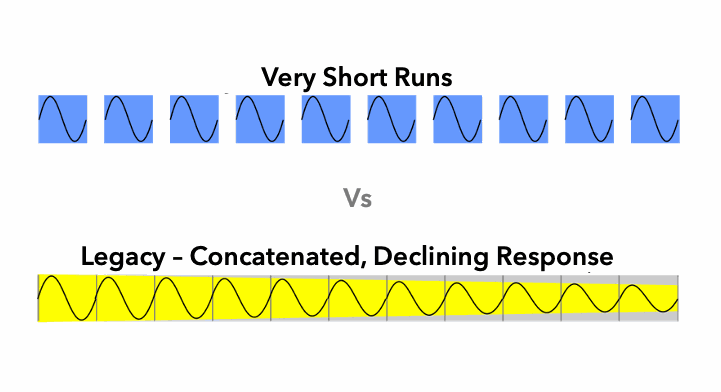
Process: Very Short Runs
Test sequence is broken up into 10 "very short runs" each about 2 to 6 seconds each.
Very short runs simplifies administration of the test by the technician and eases patient compliance for short attention spans.
Very short runs have a mathematical advantage for response averaging as well as on the fly assessment of data consistency on each short run.
Process: Response Isolation
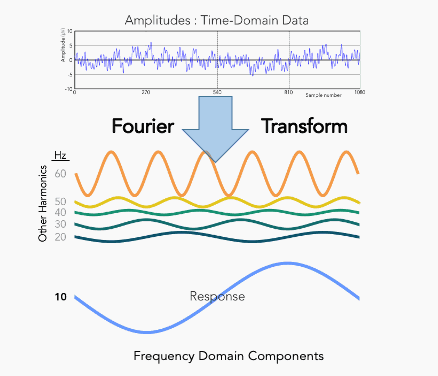
The response, a complex waveform, is recorded (time domain amplitudes over time) composed of 1,000's of data points used in the analysis.
The response is Fourier transformed into the frequency domain and deconstructed into its component frequencies. In this case, we are interested in the stimulus frequency used which here is the 10 Hz. response inclusive of its timing and form.
The illustration at the right shows examples of various frequencies recorded including the targeted (blue) 10 Hz component.
The complex waveform is a composite of frequencies from the stimulus and other unwanted, non-related, biological and extraneous "noise".
The Fourier Transform Analytic Tools
Contact us to arrange an online presentation on how to improve your objective functional diagnostics
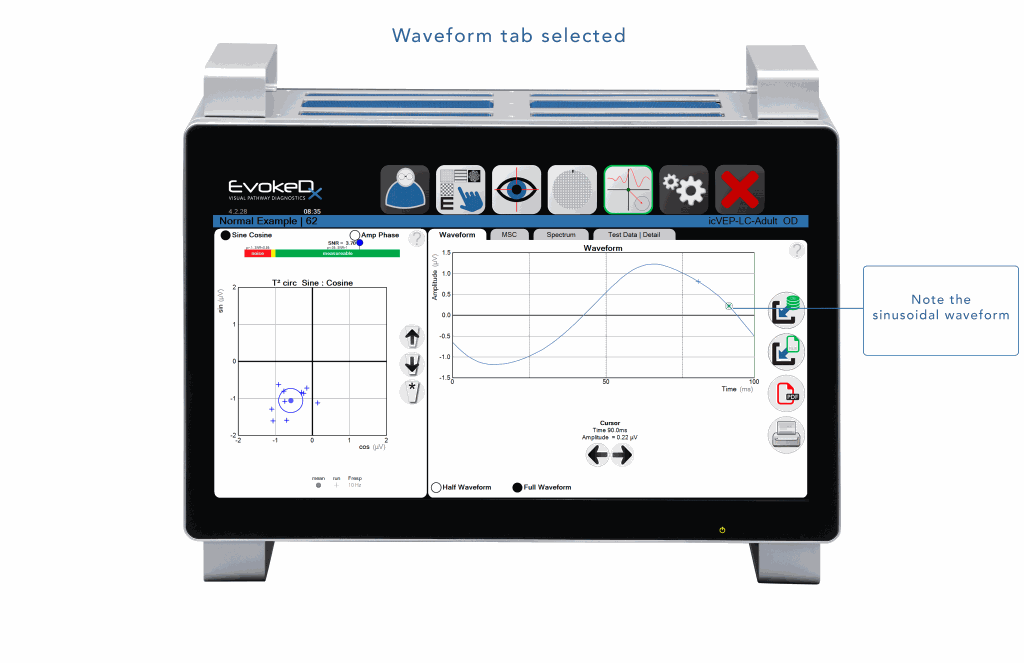
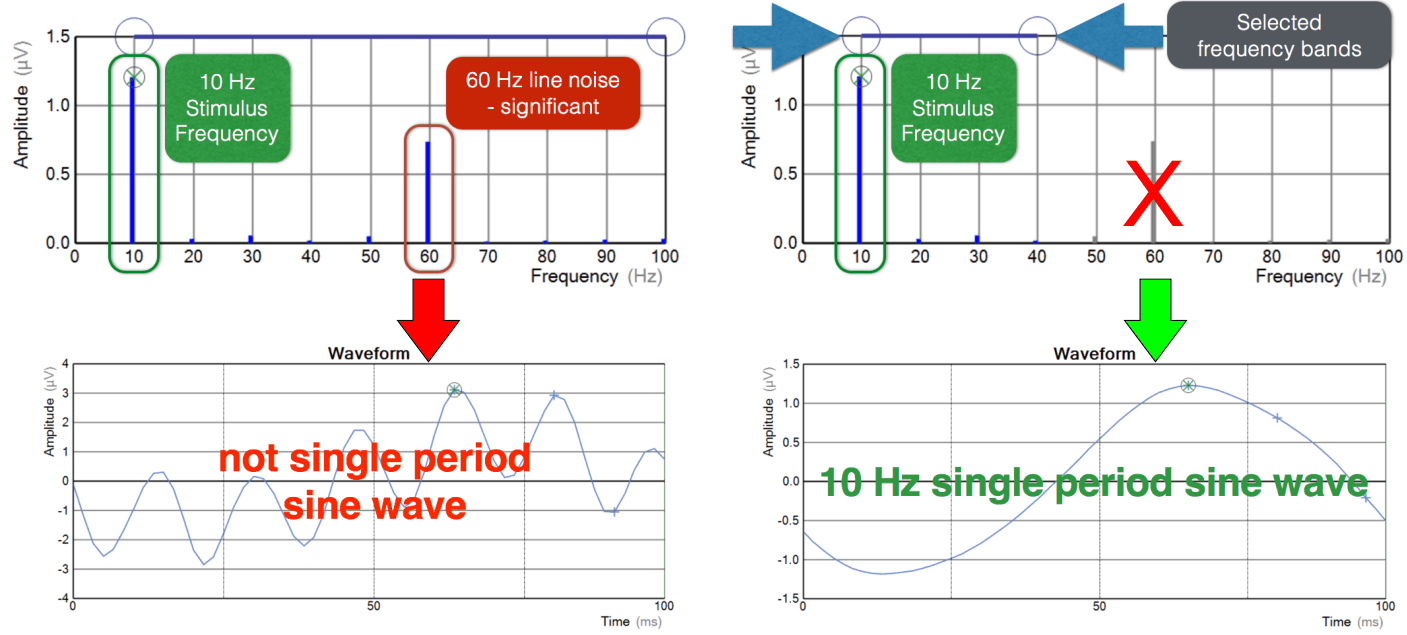
Fourier Reconstructed Waveform
After selective filtering in the frequency domain, the waveform is then reconstructed into a modified time-domain waveform.
This robust method can have spectacular results in uncovering significant data that is over-powered / obscured by other frequencies such as line-noise from the power grid or other devices in the room.
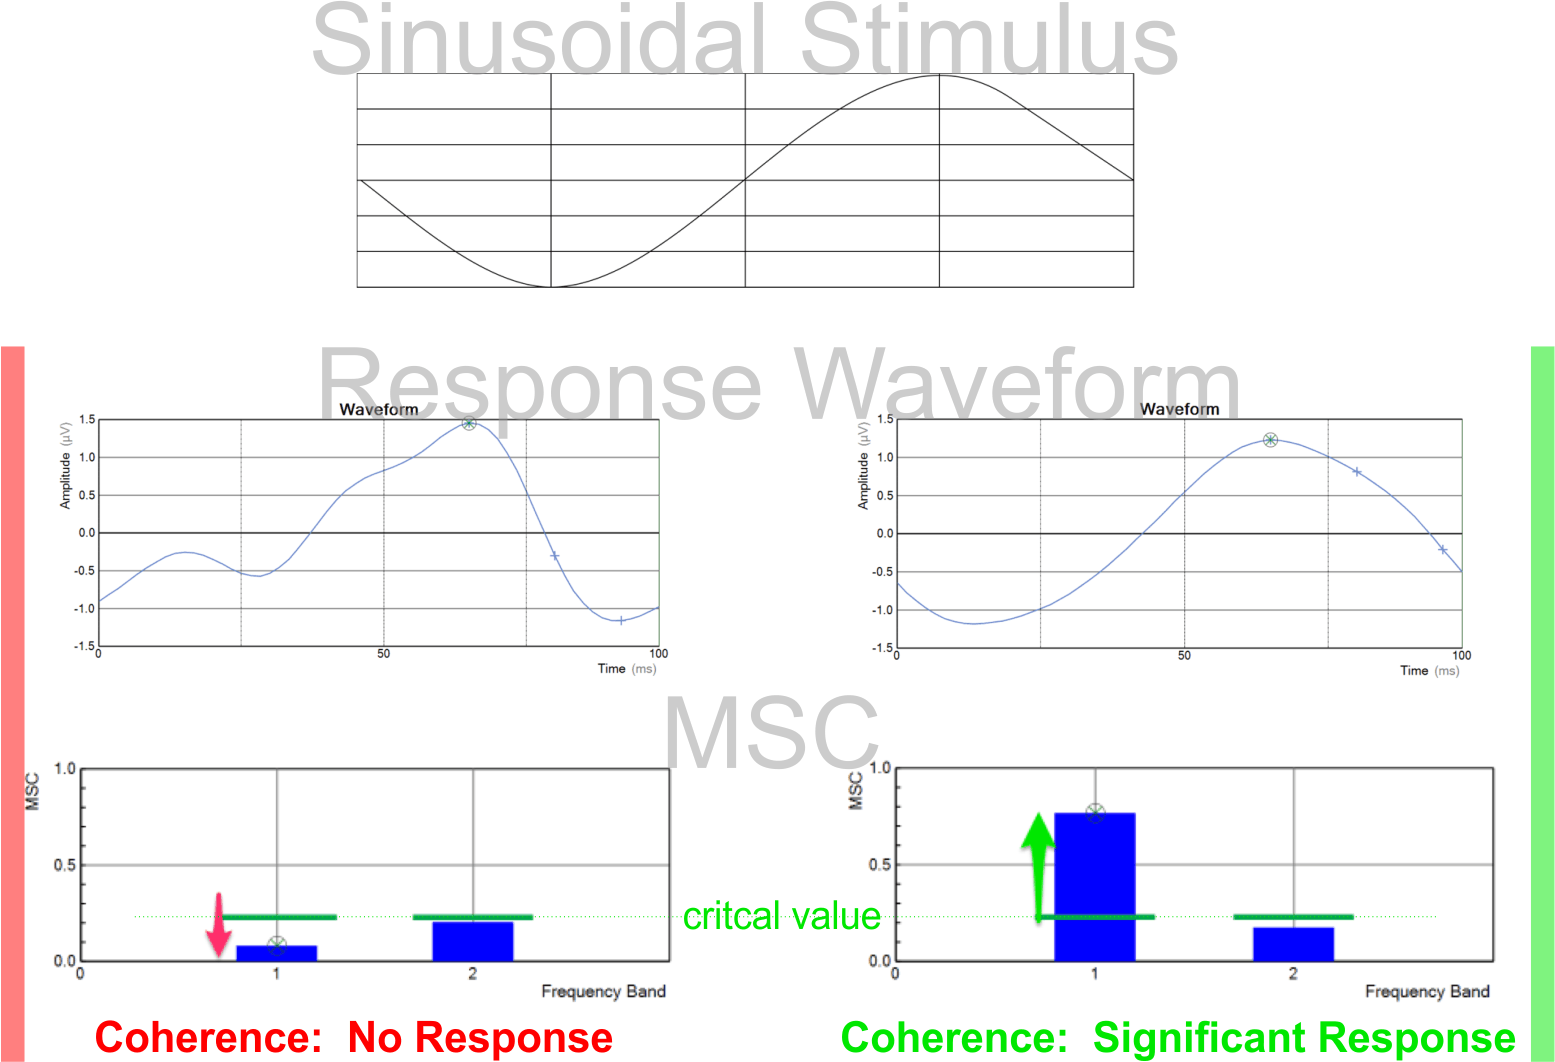
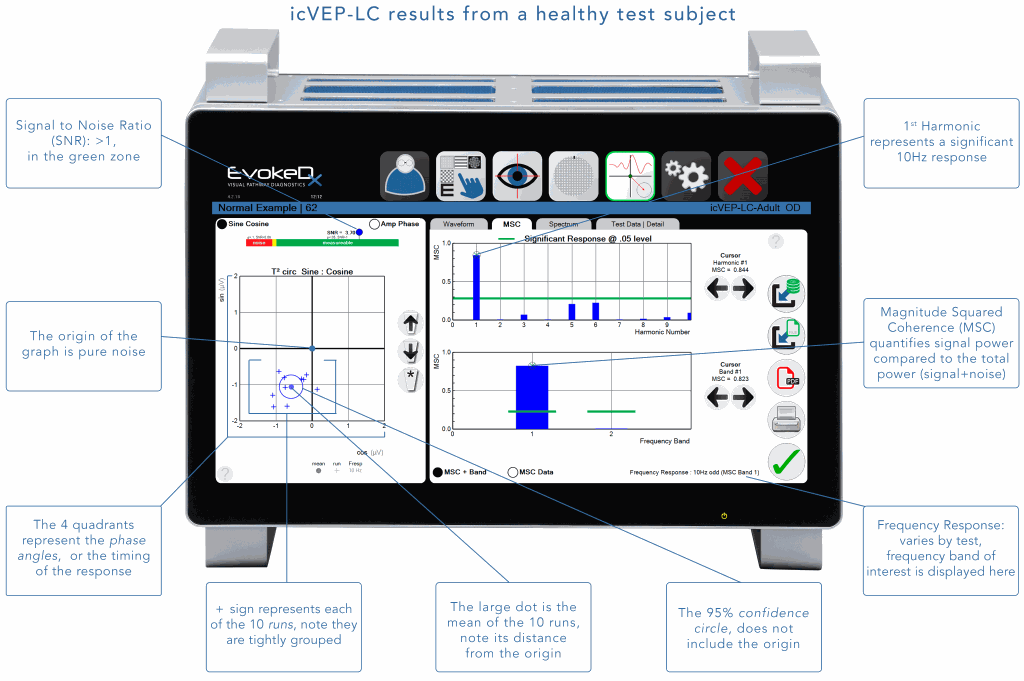
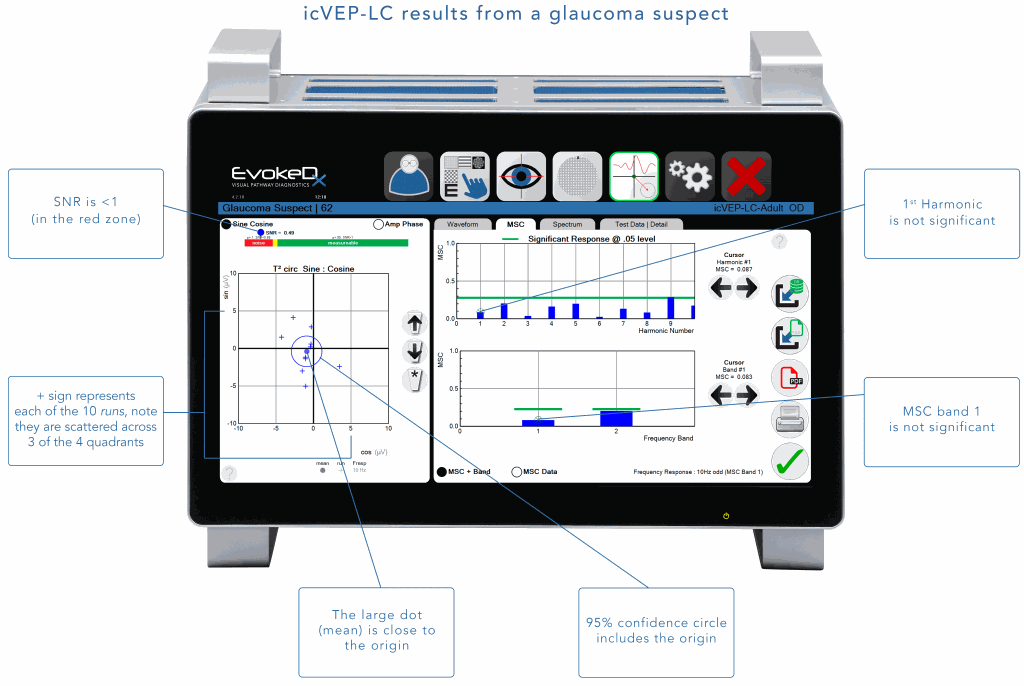
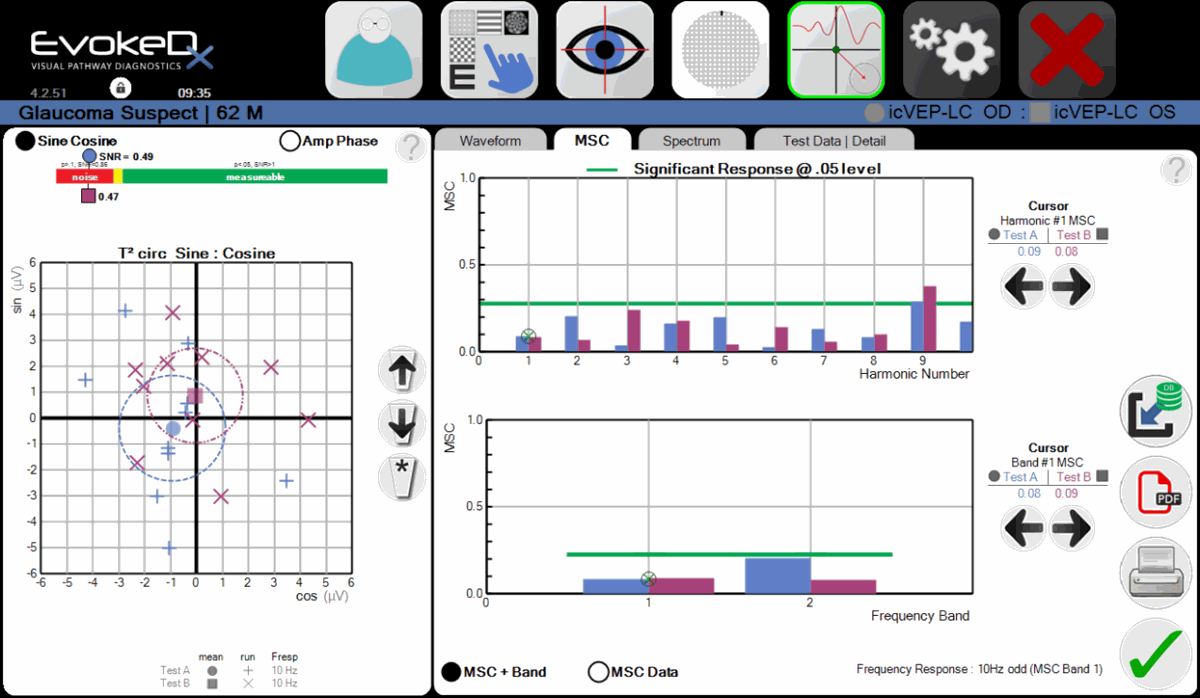
Coherence (MSC)
A measure of Coherence is used to quantify the level of signal power in the response compared to the total power (signal + noise). Termed Magnitude Squared Coherence (MSC), a frequency component of interest is calculated and compared to a critical value and is then displayed graphically to show if a significant response exists at that frequency. Perfect coherence of the recorded response to the stimulus would be indicated by an MSC value of 1.0 (which does not occur in nature).
Additionally, average MSC values for bands of frequency components are calculated that have experimentally been found to reflect distinct neural mechanisms.
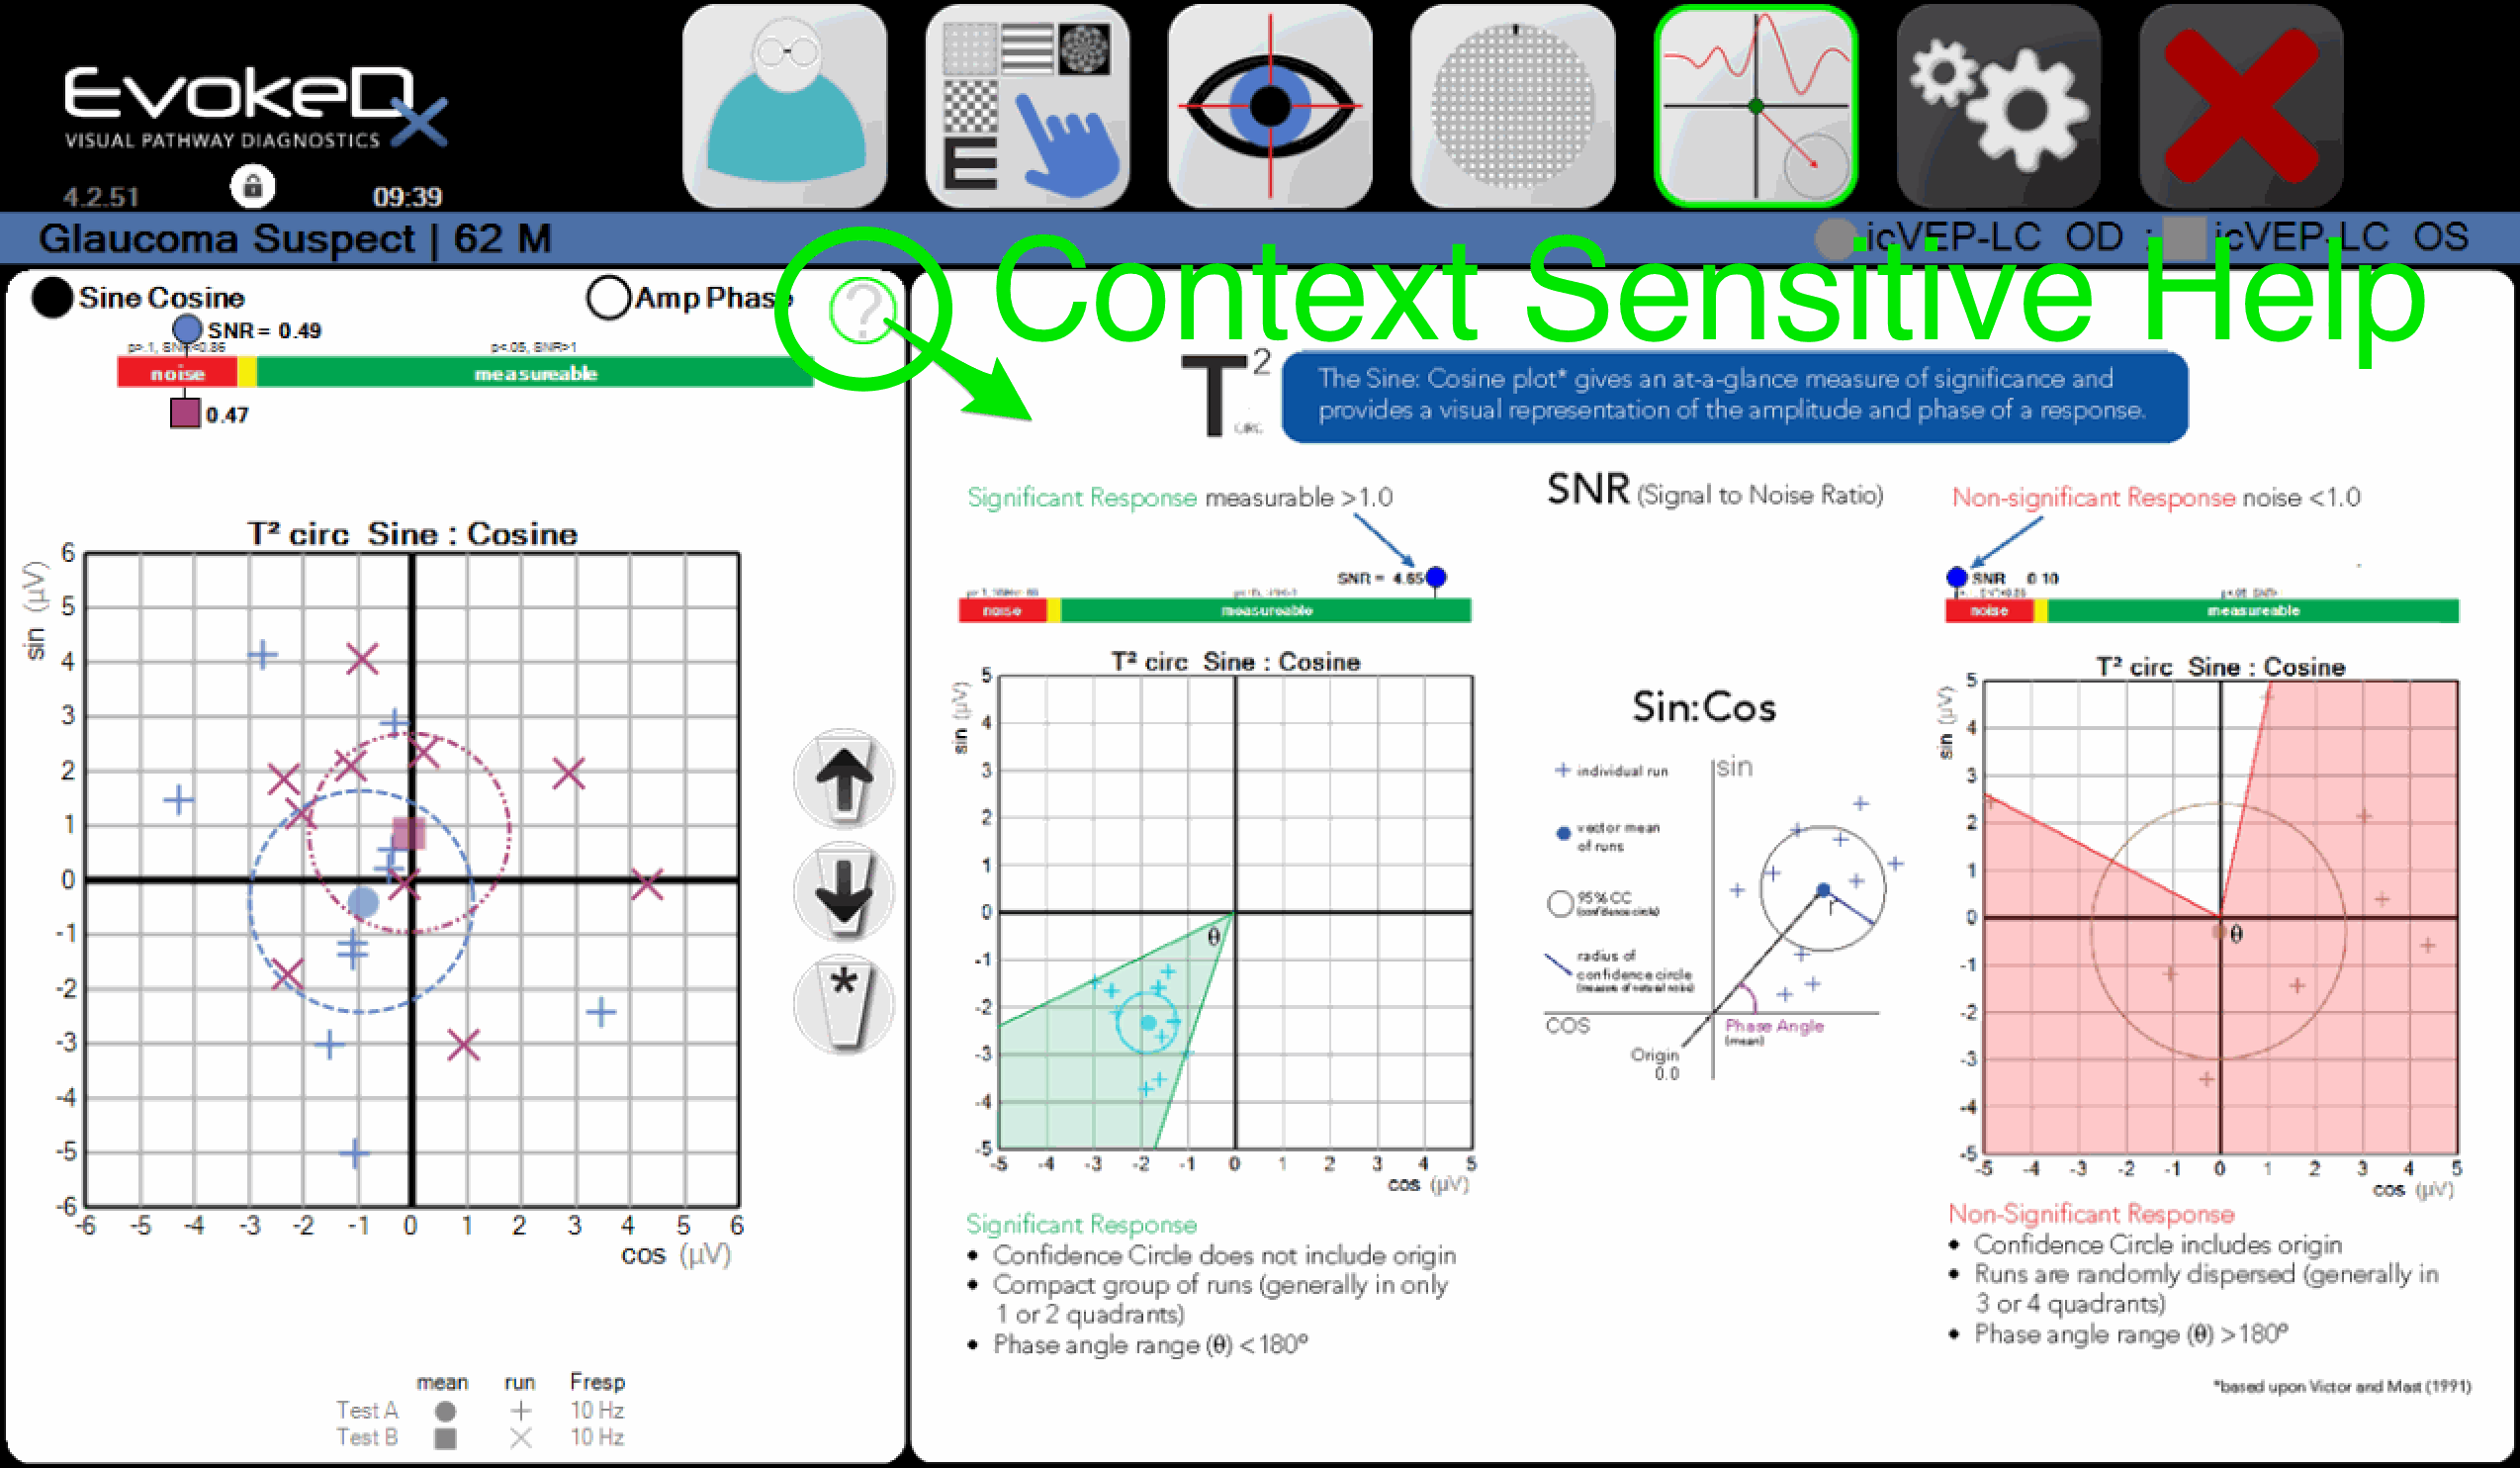
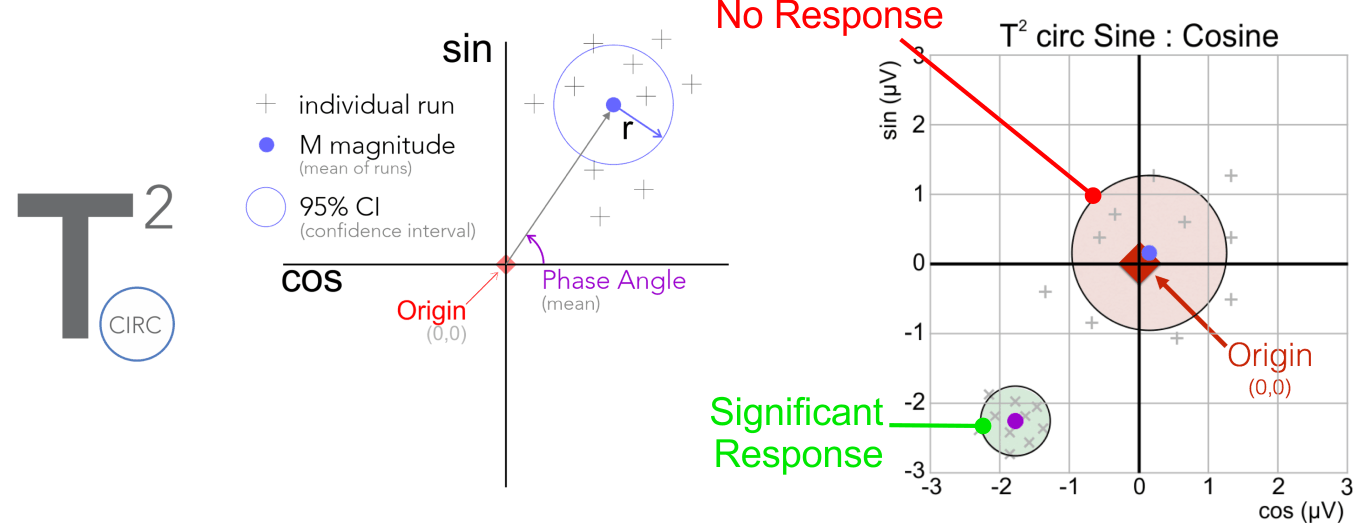
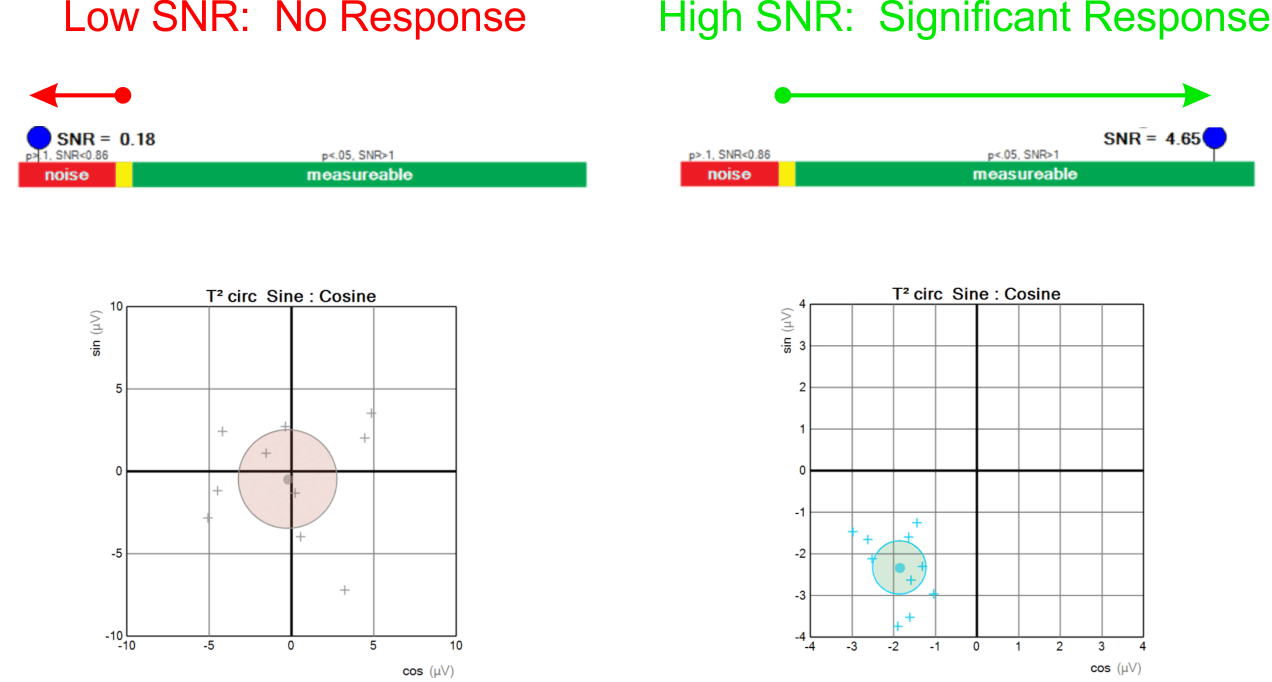
T²CIRC
This multivariate statistic is calculated on the sine and cosine coefficients of a VEP frequency component to estimate the variability (noise) in the set of responses at the test’s Frequency Component of Interest (FCI). Each individual run’s response component is plotted, with the vector-mean (dot), and a noise circle (radius r) indicating the 95% confidence circle (CC). If the noise circle includes the origin, the response is not significant
SNR
Signal to Noise Ratio is the strength of the recorded signal at the frequency of interest relative to the level of noise at the same frequency. A SNR value below 1 indicates that the noise circle overlaps the origin of the sine-cosine plot and that the response is not significant at the .05 level, and above 1 indicates a significant response.
FSTAT
FSTAT assesses if two sweep VEP/ERG functions are statistically different (.05 level) or not. For example, the FSTAT may be used to determine if fellow eye monocular responses are matched or differ sufficiently to raise concerns about a unilateral condition such as amblyopia.
Instant, intuitive test comparisons
A robust comparison feature allows instant comparisons, as examples:
-
compare right and left eyes on same day
-
compare same eye from a prior exam to assess progression
-
compare how a bright response compares to dark response same pattern
-
compare how a small check response compares to large check response
-
compare how one patient compares to another patient of known characteristics
On-screen graphical help
On viewing results, a concise walk-through of time domain, frequency domain and Fourier analytics is augmented by one-touch help screens. These provide context-sensitive, richly illustrated explanations of all analytic components for all tests.
Scratching your head to understand your first generation VEP / ERG results? Let us help you with elegantly illustrated statistical tools only available in the “Frequency Domain”